Since its Tax Day, I thought we might take a look at where your tax dollars go and where they come from.
The first chart is Federal Revenues — what the sources of cash are from all sources. As you can see, the biggest revenue line is individual income taxes, accounting for 46% of revenues. Payroll taxes, split between the employer and employee, account for another 31.7%. Corporate taxes are a mere 13.5%, with assorted customs, duties and excise tax making up the last few percent.
Federal Revenues
What we spend those trillions on can be seen in the second chart: 33.6% goes to social security and Unemployment benefits; Medicare and health related spending captures another 26.6%. Next up, Military including Veterans benefits captures a huge 20.4% of the budget.
The last 2o% or so goes to lots of smaller departments: Interest on Debt grabs 6.3%, then Food & Agriculture take 3.3%, Transportation (2.6%), Housing (2.6%), Education (2.0%), Energy (1.1%) and Science (0.7%.)
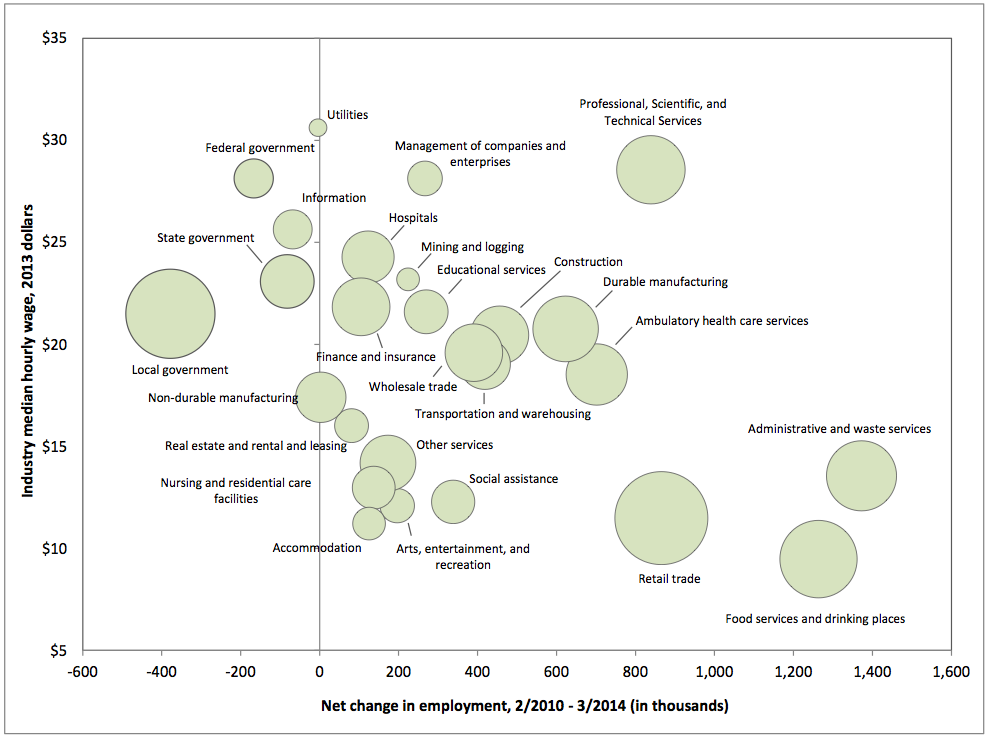
Highlights Job growth is improving but not quite as much as forecast. Total nonfarm payroll jobs rose 192,000 in March after a 197,000 boost in February and a 144,000 increase in January. The net revision for the prior two months was up 37,000. Expectations for March were for 206,000. Private payrolls gained 192,000, following an increase of 188,000 in February. Analysts projected 215,000 for March.
The unemployment rate held steady at 6.7 percent. The consensus projected 6.6 percent.
Turning back to the payroll portion of the report, goods-producing jobs rose 25,000 in March after a gain of 40,000 in February. Construction advanced 19,000, following a 18,000 increase the month before. Manufacturing jobs slipped 1,000 after rising 19,000 in February.
Private service-providing jobs increased 167,000, following an 148,000 rise in February. Professional and business services added 57,000 jobs in March. Health care added 19,000 jobs. Retail trade gained 21,000.
Government jobs were flat after rising 9,000 in February.
Average weekly hours improved to 34.5 from 34.3 in February. Average hourly earnings came off as unchanged in March after a spike of 0.4 percent in February.
Overall, the labor market is improving but very gradually. The doves at the Fed-including Chair Yellen-almost certainly will see this report as still too soft.
Market Consensus before announcement Nonfarm payroll employment gained 175,000 in February after a 129,000 rise in January and an 84,000 increase in December. The net revision for the prior two months was up 25,000. The BLS did note that atypically severe winter weather occurred during the payroll reference period. While not specifically stating, the implication is that the labor market is somewhat stronger than the official payroll number for February. The unemployment rate nudged up to 6.7 percent in February from 6.6 percent the month before. Average weekly hours slipped to 34.2 from 34.3 in January. This dip almost certainly was weather related. A big plus in the report for February was a jump in average hourly earnings growth to 0.4 percent from 0.2 percent the prior month.
Definition The employment situation is a set of labor market indicators based on two separate surveys in this one report. The unemployment rate equals the number of unemployed persons divided by the total number of persons in the labor force, which comes from a survey of 60,000 households (this is called the household survey). Workers are only counted once, no matter how many jobs they have, or whether they are only working part-time. In order to be counted as unemployed, one must be actively looking for work. Other commonly known figures from the Household Survey include the labor supply and discouraged workers. Why Investors Care
During the mature phase of an economic expansion, monthly payrolls gains of 150,000 or so are considered relatively healthy. In the early stages of recovery though, gains are expected to surpass 250,000 per month. Data Source: Haver Analytics
The civilian unemployment rate is a lagging indicator of economic activity. During a recession, many people leave the labor force entirely, so the jobless rate may not increase as much as expected. This means that the jobless rate may continue to increase in the early stages of recovery because more people are returning to the labor force as they believe they will be able to find work. The civilian unemployment rate tends towards greater stability than payroll employment on a monthly basis. It reveals the degree to which labor resources are utilized in the economy. Data Source: Haver Analytics
Six months ago, global finance officials meeting in Washington berated the U.S. for failing to put its fiscal house in order. This time, the critics were silent.
The Congressional Budget Office projected today that the 2014 deficit
will be the lowest in six years and down more than 60 percent from the
record $1.4 trillion in 2009. With the annual April 15 tax filing
deadline looming, the U.S. has received about $80 billion more in income
taxes this fiscal year than it had 12 months earlier.
The
Treasury’s coffers are swelling as the almost five-year economic
expansion gains momentum, generating more corporate and personal
income-tax revenue and reducing spending on social services. Stronger
growth, in turn, will depend less on government spending to fuel growth
than it has in the past.
“Without fiscal stimulus, we’ll see
over the next year or two if the economy is really standing on its own
two feet,” said Ira Jersey, a fixed-income and interest-rate strategist
at Credit Suisse Group AG in New York. “We suspect it is. This means
further improvement of the deficit over the next few years.”
More
evidence of fiscal health came last week, when the Treasury Department
reported a deficit of $36.9 billion, the smallest for that month in 14
years. Revenue increased 16 percent to $215.8 billion from $186 billion
in March 2013. Spending totaled $252.7 billion, down 13.6 percent.
Photographer: Joshua Roberts/Bloomberg
The Congressional Budget Office is projecting the 2014 deficit will be the lowest in... Read More
Corporate tax revenue may climb further as accelerating growth and declining unemployment
boost sales and earnings. The International Monetary Fund, in a report
last week, forecast a U.S. expansion of 2.8 percent this year and 3
percent in 2015, compared with 1.9 percent last year.
Japan, Europe
The
U.S. is strengthening as other developed economies struggle to grow.
The 18-country euro area will expand 1.2 percent this year and 1.5
percent in 2015, according to IMF projections. Japan, the world’s third-largest economy, will gain 1.4 percent in 2014 followed by 1 percent the year after.
“The
United States recovery continues to gain strength, while other
countries continue to adjust and reform,” Treasury Secretary Jacob J.
Lew said in an April 11 statement during meetings in Washington held by
the IMF and World Bank.
Things were different when central
bankers and finance ministers of the world’s 20 biggest industrial and
developing countries met in Washington in October. Then, the U.S. was in
the midst of a partial government shutdown with politicians locked in a
stalemate over raising the federal debt ceiling.
Debt Limit
IMF
Managing Director Christine Lagarde urged the U.S. at the time to show
leadership and warned that failure to lift the debt limit risked
triggering a global recession. The administration of Barack Obama and Republicans in Congress eventually agreed to end the 16-day shutdown and suspended the $16.7 trillion limit.
Now, Michael Darda, chief economist at MKM Partners LLC in Stamford, Connecticut,
estimates the U.S. deficit fell to 2.9 percent of gross domestic
product in the first quarter from a peak of more than 10 percent in
2009.
Among the reasons, he said in an April 11 note: “a
sustained, albeit moderate, economic recovery” and the 2013 automatic
spending cuts and tax increases known as sequestration.
The
deficit will shrink to $492 billion this year from $680 billion in 2013,
according to the CBO, which today projected a gap of $469 billion in
2015. After that, the deficit will start rising every year, reaching $1
trillion by 2023.
The increase will be driven by “dramatically”
rising Medicare and Social Security payments needed to care for an aging
society, said Jersey of Credit Suisse.
Fiscal Drag
For
now, a slower pace of decline in the budget deficit will provide a
tonic for the economy because fiscal “drag” -- the contractionary effect
of reduced fiscal stimulus -- is abating, says Lou Crandall, chief economist at Wrightson ICAP LLC in Jersey City, New Jersey.
“If
the projected declines over the next couple of years were larger as a
percentage of GDP, they would be giving rise to more fears about fiscal
drag,” he said.
The lessening fiscal headwinds and an improving
labor market are among the reasons the Federal Reserve is pulling back
on the monthly bond purchases intended to spur growth and employment.
The
near-term outlook isn’t without concerns. Last week was the worst for
the Standard & Poor’s 500 Index since 2012. Investor worries
included disappointing results at JPMorgan Chase & Co. and signs
that hedge funds were dumping the bull market’s top performers.
Consumer Confidence
Still, Americans are growing more upbeat as job prospects improve. Consumer confidence rose in April to the highest level since July (CONSSENT), according to the Thomson Reuters/University of Michigan preliminary index of sentiment released last week.
Payrolls
excluding government agencies rose by 192,000 workers in March after a
188,000 gain in February that was larger than first estimated, according
to Labor Department figures released April 4. That brought the job
count to 116.1 million, exceeding the pre-recession peak for the first
time.
Lew, in his April 11 statement, said the U.S. expansion
“is expected to strengthen further this year as private-sector demand
increases, the fiscal drag lessens, and household balance sheets and the
housing market continue to improve.”
To contact the reporter on this story: Ian Katz in Washington at ikatz2@bloomberg.net
To contact the editors responsible for this story: Chris Wellisz at cwellisz@bloomberg.net Mark Rohner


![[Chart]](https://lh3.googleusercontent.com/blogger_img_proxy/AEn0k_u_t8jZxPJbJlXkZXi2SYF2H0_S6f3ryNsA41YAdJQK0nbtZsFgFH21gqmdxHIPJQHLXDRJ2Y0jQYErPuxjcdMoO0kl4jDo2R9CfgJU6PmV2RzApkokWQ=s0-d)
![[Chart]](https://lh3.googleusercontent.com/blogger_img_proxy/AEn0k_sn0zEueFrR7qAjkBui7e5IUNtVOkHG1RskZHCr1AXr2bE0GDLuk4FB2aHFMs1mJBnD2YJ7jOrZQPoy9VliwwmV2gcKT3Z4ecPxyFvEOONXoFBAc6df3Q=s0-d)


