Boom! US economy logs best performance in nearly 4 years https://www.cnbc.com/2018/08/29/second-estimate-of-q2-2018-gdp.html
http://mam.econoday.com/byshoweventfull.asp?fid=485682&cust=mam&year=2018&lid=0&prev=/byweek.asp#top
Historical GDP
https://tradingeconomics.com/united-states/gdp-growth
Showing posts with label GDP. Show all posts
Showing posts with label GDP. Show all posts
Wednesday, August 29, 2018
Tuesday, March 27, 2018
CNBC: Leading indicators up 0.6% in February, vs. expectations for 0.4% gain
CNBC: Leading indicators up 0.6% in February, vs. expectations for 0.4% gain https://www.cnbc.com/2018/03/22/leading-indicators-february.html
http://mam.econoday.com/byshoweventfull.asp?fid=486207&cust=mam&year=2018&lid=0&prev=/byweek.asp#top
About leading indicators and why investors care:
http://mam.econoday.com/byshoweventfull.asp?fid=486207&cust=mam&wiconly=1&lid=0#top
http://mam.econoday.com/byshoweventfull.asp?fid=486207&cust=mam&year=2018&lid=0&prev=/byweek.asp#top
About leading indicators and why investors care:
http://mam.econoday.com/byshoweventfull.asp?fid=486207&cust=mam&wiconly=1&lid=0#top
Thursday, February 1, 2018
Monday, October 31, 2016
Monday, September 19, 2016
Monday, August 29, 2016
Wednesday, August 26, 2015
Expected GDP revision for 2nd quarter
http://mam.econoday.com/byshoweventfull.asp?fid=467023&cust=mam&year=2015&lid=0&prev=/byweek.asp#top
| ||||||||||||||||||||||||||||||||||||||||||||||||||||||||||||||||||||||||||||||||||||||||||||||||||
powered by  | ||||||||||||||||||||||||||||||||||||||||||||||||||||||||||||||||||||||||||||||||||||||||||||||||||
| U.S. & Intl Recaps | Event Definitions | Today's Calendar | ||||||||||||||||||||||||||||||||||||||||||||||||||||||||||||||||||||||||||||||||||||||||||||||||||
| ||||||||||||||||||||||||||||||||||||||||||||||||||||||||||||||||||||||||||||||||||||||||||||||||||
![[Chart]](https://lh3.googleusercontent.com/blogger_img_proxy/AEn0k_uUsNPj5jSWoimSHyBoDjSsWW_PAGC_2lLr-WeDIpSmquTKV6Qy6LGohXeUHgMqzS1mDIkrDTzvVgPjLgmpaZ_Le7w25YtU6Jl2qEmJHci0Q2Rb82DU=s0-d)
![[Chart]](https://lh3.googleusercontent.com/blogger_img_proxy/AEn0k_uQ8R3km16yHjiitQQwC9AlIc6ryCEBrvD9ID9mvnJozdKNP8v5GlmUuvNrX-0irGo9I5UsuPynwb0j7RuEHrw1YXMKT-2QgTX_KTapD0RCSlC3WfGNiw=s0-d)
Wednesday, December 24, 2014
GDP revision
http://mam.econoday.com/byshoweventfull.asp?fid=461149&cust=mam&year=2014&lid=0&prev=/byweek.asp#top
| GDP | |||||||||||||||||||||
| |||||||||||||||||||||
Highlights
Third-quarter GDP was revised sharply higher to plus 5.0 percent for the strongest rate since way back in third-quarter 2003. Today's second revision, up 1.1 percentage points from the first revision and compared to plus 4.6 percent for the second quarter, reflects gains for health care, recreation, financial services, and software. Final sales were also revised sharply higher, to plus 5.0 vs a prior reading of 4.1 percent. GDP prices remain soft at plus 1.4 percent in a reading that is likely to ebb further given this quarter's drop in oil prices. Today's results point to unexpectedly strong economic momentum going into the current quarter. | |||||||||||||||||||||
Recent History Of This Indicator
GDP grew 3.9 percent in the third quarter versus the advance estimate of 3.5 percent. Growth still decelerated from the second quarter weather rebound of 4.6 percent annualized. With the second estimate for the third quarter, private inventory investment decreased less than previously estimated, and both personal consumption expenditures (PCE) and nonresidential fixed investment increased more. In contrast, exports increased less than previously estimated. On the price front, the chain-weighted price index was revised up marginally to 1.4 percent, compared to the advance estimate of 1.3 percent annualized from 2.1 percent in the second quarter. The core chain index, excluding food and energy, eased to 1.7 percent but was slightly higher than the initial estimate of 1.6 percent. | |||||||||||||||||||||
| Definition Gross Domestic Product (GDP) is the broadest measure of aggregate economic activity and encompasses every sector of the economy. Why Investors Care | |||||||||||||||||||||
| |||||||||||||||||||||
| |||||||||||||||||||||
![[Chart]](https://lh3.googleusercontent.com/blogger_img_proxy/AEn0k_tTvI4PnKq9Gzq0kw16ocf5nUKVnfCesuK29AAYStZ2HNru5InvrVDsi0851d23TdMV_dz5gzPQ2Qurg0BA5M0PNEtOrkUIN1_1zaLa8UgSG3Vs_2PH=s0-d)
![[Chart]](https://lh3.googleusercontent.com/blogger_img_proxy/AEn0k_t2LR2inu7L8eGPLcMUbe3XmYMvaJZIrK-gXfbbXSSKS8ZbOgWTDgfQhhYtHAnPJNNBK-N3216-abqeQCGu6MEtp46-WCdG0tthQWDmm9NqJEoPjD7XeA=s0-d)
Thursday, December 4, 2014
Economic data website from Federal Reserve
http://research.stlouisfed.org/fred2/
Data for North Carolina:
http://research.stlouisfed.org/fred2/categories/27315
Maps:
Average Hourly Earnings in Private Sector:
http://geofred.stlouisfed.org/map/?th=pubugn&cc=5&rc=false&im=fractile&lng=-90&lat=40&zm=4&sl&sv&dth=0a623eb20a3109cabfd9c50b367d2558&rt=state&undefined&at=Not%20Seasonally%20Adjusted,%20Annual,%20Dollars%20per%20Hour&fq=Annual&am=Average&un=lin&dt=2013-01-01
Friday, October 3, 2014
Tuesday, September 30, 2014
GDP
http://mam.econoday.com/byshoweventfull.asp?fid=461146&cust=mam&year=2014&lid=0&prev=/byweek.asp#top
|
|||||||||||||||||||||||||||||||||||||||||||||||||||||||||||||||||||||||||||||||||||||||||||||||||||||||||||||
|
POWERED BY
|
|||||||||||||||||||||||||||||||||||||||||||||||||||||||||||||||||||||||||||||||||||||||||||||||||||||||||||||
|
U.S. & Intl Recaps | Event Definitions | Today's Calendar
|
|||||||||||||||||||||||||||||||||||||||||||||||||||||||||||||||||||||||||||||||||||||||||||||||||||||||||||||
|
| ||||||||||||||||||||||||||||||||||||||||||||||||||||||||||||||||||||||||||||||||||||||||||||||||||||||||||||
![[Chart]](https://lh3.googleusercontent.com/blogger_img_proxy/AEn0k_sj7Esq8qoVMzQoHXQmwmX4AroZBETqgODS2Y86g5VDT_lQOA0EcY4ckioAyDCK_OSqlOBbwxZ3KQuIa8qjVHsz0wQU1ltindvx8V5la54x7q4Kjf_Dww=s0-d)
![[Chart]](https://lh3.googleusercontent.com/blogger_img_proxy/AEn0k_smlCVAzJ_5z6NnkvzcqwSR4PEYxmOFK6j8W_yfk_f6odA-EetvrtlmgmU6XcfDIbCzw_wVaycCkA4Nq3l8eHCT36PBJulm2FwMLMn5oHdc0bBQBVEa=s0-d)
Thursday, September 18, 2014
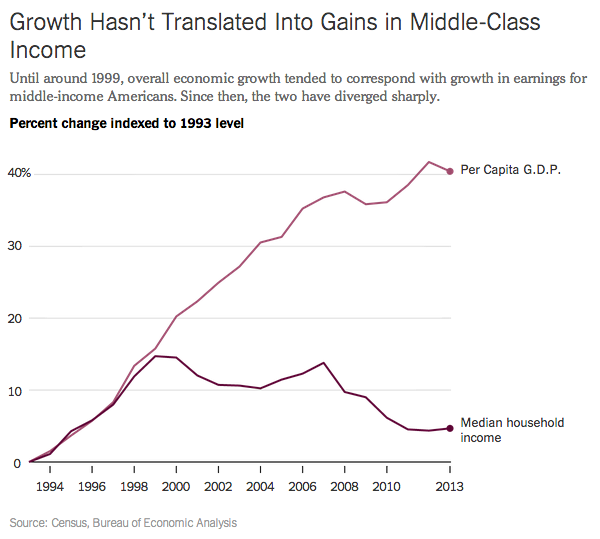
GDP growth and incomes
http://www.ritholtz.com/blog/2014/09/10-wednesday-pm-reads-33/
You Can’t Feed a Family With GDP

Source: The Upshot
You Can’t Feed a Family With GDP
Source: The Upshot
Thursday, September 11, 2014
Economic impact of September 11, 2001 terrorist attack
Thursday, November 7, 2013
GDP
http://mam.econoday.com/byshoweventfull.asp?fid=456061&cust=mam&year=2013&lid=0&prev=/byweek.asp#top
| GDP | ||||||||||||||||||
| ||||||||||||||||||
Highlights
GDP growth for the third quarter surprised on the high side but inventories played a big role. Real GDP grew 2.8 percent in the third quarter, following a 2.5 percent rise the quarter before. Analysts projected a 2.0 percent rise. By contributions to growth, it was a mix. PCEs rose an annualized 1.5 percent, contributing 1.04 percentage points to GDP. Inventories gained $86.0 billion, following a $56.6 billion increase in the second quarter-leading to a third quarter contribution of 0.83 percentage points. However, PCEs slowed for the quarter after a 1.8 percent increase in the second quarter. Net exports played a notable role in the boost to GDP growth but in the wrong way. Import growth decelerated to 1.9 percent, following a 6.9 percent jump in the second quarter. Essentially, demand slowed. Exports grew but at a slower pace of 4.5 percent versus 8.0 percent in the second quarter. Housing investment remained healthy as did nonresidential structures. Equipment investment slipped while government purchases were basically flat. But overall demand is sluggish. Final sales of domestic product rose 2.0 percent in the third quarter after a 2.1 percent increase the prior period. Final sales to domestic purchasers softened to a 1.7 percent gain, following a 2.1 percent rise in the second quarter. Inflation was a little warmer than expected. The overall GDP price index rose 1.9 percent, following a 0.6 percent annualized gain in the second quarter. Market expectations were for a 1.4 percent annualized gain. Excluding food and energy, inflation was 1.9 percent in the third quarter, following a 0.9 percent rise the previous quarter. Overall, the economy is not as strong as the headline suggests. We may see some pullback in the fourth quarter on inventories. On the news, equities were little changed. | ||||||||||||||||||
Market Consensus before announcement
GDP for the third estimate for the second quarter was left unchanged at an annualized rate of 2.5 percent compared to the second estimate and compared to a first quarter rise of 1.1 percent. The biggest positive note was that demand numbers were bumped up slightly-though remained sluggish. Final sales of domestic product were revised up to 2.1 percent from the second estimate of 1.9 percent. This series increased 0.2 percent in the first quarter. Final sales to domestic producers (which exclude net exports) also were nudged up to 2.1 percent versus the second estimate of 1.9 percent. This followed a 0.5 percent gain in the first quarter. Headline inflation for the GDP price index was revised down to 0.6 percent compared to the second estimate of a 0.8 percent annualized inflation rate. When excluding food and energy, inflation for the second quarter was nudged down to 0.9 percent from the second estimate of 1.1 percent annualized. | ||||||||||||||||||
| Definition Gross Domestic Product (GDP) is the broadest measure of aggregate economic activity and encompasses every sector of the economy. Why Investors Care | ||||||||||||||||||
| ||||||||||||||||||
| ||||||||||||||||||
![[Chart]](https://lh3.googleusercontent.com/blogger_img_proxy/AEn0k_urni3t7ZLoAiFUHfgTUuq9WvEZAX8h_N1EQ9bwO0Kf1c1KI15t9M3ow3TTtYgPIZQGkGtGgdbFF97oE70KqW17APoCyAq74eno2xFj9HT3K-e51k2vhg=s0-d)
![[Chart]](https://lh3.googleusercontent.com/blogger_img_proxy/AEn0k_sxf9dhX1-Ku6HNDuLIITevvTRCs5aziXNOn4WJBMnxotDBMK-pApx8Z3VoB5kxCFA67aCBFj9NMxMs6tgTItWoR8TF0S_2QNveMFROSJBzLmXfmG8=s0-d)
Thursday, September 12, 2013
GDP Second quarter 2013
http://money.cnn.com/2013/08/29/news/economy/gdp-report/index.html
U.S. economic growth stronger than thought
August 29, 2013: 9:33 AM ET
NEW YORK (CNNMoney)
The U.S. economy grew significantly faster than thought in the second quarter, which may help convince the Federal Reserve to start unwinding its stimulus program sooner rather than later.
The nation's gross domestic product -- the broadest measure of economic activity -- rose at a 2.5% annual rate from April through June, according to a revised estimate from the Bureau of Economic Analysis Thursday. That's higher than the 1.7% rate originally reported, and better than the 2.1% rate that economists surveyed by Briefing.com were expecting.The big upward revision was primarily the result of a better trade balance -- the nation exported more and imported less than previously thought, according to Paul Ashworth, chief US Economist at Capital Economics.
Related: How the Fed can taper without killing housing
All economic news is being closely watched for signs on when the Federal Reserve will begin curtailing its controversial bond-buying program. The stronger economic growth emboldens views that the Fed could start pulling back as soon as next month.
"The upward revision should give Fed officials more confidence that the recovery is gathering steam as the fiscal drag begins to fade," Ashworth wrote in a research note. "Under those circumstances, we still think the Fed will begin tapering its monthly asset purchases in September."
The Fed has been buying $85 billion a month in Treasuries and mortgage-backed securities in an effort to keep interest rates low and spur economic growth. Last May, Fed Chairman Ben Bernanke outlined a plan to begin "tapering" the purchases, and pegged the timing of that plan to improving economic data.

While 2.5% growth is decent, it's still below the 3.3% the economy has averaged since 1929. The August jobs report -- set for release next Friday -- will provide additional, and more current, data on the health of the U.S. economy.
The government revises its GDP figures several times after the initial release. This is the second estimate for second quarter GDP.
http://mam.econoday.com/byshoweventfull.asp?fid=456059&cust=mam&year=2013&lid=0&prev=/byweek.asp#top
| POWERED BY
|
|||||||||||||||||||||||||||||||||||||||||
|
Resource Center » U.S. & Intl Recaps | Event Release Dates | Event Definitions | Today's Calendar
|
|||||||||||||||||||||||||||||||||||||||||
| |||||||||||||||||||||||||||||||||||||||||
![[Chart]](https://lh3.googleusercontent.com/blogger_img_proxy/AEn0k_tkzRnqFhI7mfk0VAzHX7SEhsDreUpUFblIoZ1mRrrLu_iMdeqY4K9qiP3wu3EReqjIBJcdqplMNbOi0WKVwd36aLpCZvNorP2rD0yekZ3GEXFdhotNMw=s0-d)
![[Chart]](https://lh3.googleusercontent.com/blogger_img_proxy/AEn0k_skdrPVsQZXqsZGSiHjJte4PY9KiEK9wplm4o5Acy91g70lXrpq7O7NdZLo17Fdclw3rV3L1HKdB5WfR7ZJRP_6Z9gEEudo9o7J5ChYJR1reKSBmT3lOQ=s0-d)
Friday, April 26, 2013
GDP first quarter 2013
http://mam.econoday.com/byshoweventfull.asp?fid=456055&cust=mam&year=2013&lid=0
| GDP | ||||||||||||||||||
|
||||||||||||||||||
|
Highlights
The economy had some bounce in the first quarter as GDP growth showed some acceleration. But the details are not as encouraging as the headline. The first quarter grew 2.5 percent after a modest 0.4 gain in the fourth quarter. Analysts forecast a 3.1 percent boost in the first quarter. Demand growth was very sluggish with weakest component being government purchases while the bright spot was consumer spending. Final sales of domestic product increased 1.5 percent after rising 1.9 percent in the fourth quarter. Final sales to domestic producers (which exclude net exports) improved to a 1.9 percent boost, after a 1.5 percent gain in the fourth quarter. By components, inventory investment jumped to $50.3 billion from $13.3 billion. The big question is whether the second quarter boost was planned or unplanned. Personal consumption accelerated to 3.2 percent from an annualized 1.8 percent in the fourth quarter. Also on the positive side, residential investment gained 12.6 percent, though at a slower pace than 17.6 percent the quarter before. Nonresidential fixed investment advanced but also at a softer rate, 2.1 percent versus the fourth quarter's 13.2 percent. On the downside, government purchases fell 4.1 percent, but not as much as the 7.0 percent annualized drop the quarter before. Slowing global growth is showing up as the net export gap worsened to $400.8 billion from $384.7 billion. Headline inflation for the GDP price index showed mild acceleration to an annualized 1.2 percent in the first quarter from 1.0 percent the prior quarter. When excluding food and energy, inflation pressure posted at 1.5 percent, compared 1.3 percent the prior quarter. While the headline disappointed, it did show improvement. However, the component detail suggests less forward momentum than the overall number. On the news, equity futures eased somewhat. |
||||||||||||||||||
|
Market Consensus before announcement
GDP growth for the fourth quarter was revised up to an annualized rate of plus 0.4 percent from the second estimate of 0.1 percent and compared to a third quarter gain of 3.1 percent. The upward revision was largely due to a smaller net export gap, stronger growth in nonresidential structures, and somewhat higher inventory growth. Demand numbers were revised up slightly. Final sales of domestic product came in at 1.9 percent-up from the second estimate of 1.7 percent. Final sales to domestic purchasers were nudged up to 1.5 percent versus the second estimate of 1.4 percent. Headline inflation for the GDP price index posted a 1.0 percent annualized inflation rate versus the second estimate of 0.9 percent. When excluding food and energy, inflation was revised to 1.3 percent, versus the second estimate of 1.2 percent. |
||||||||||||||||||
|
Definition Gross Domestic Product (GDP) is the broadest measure of aggregate economic activity and encompasses every sector of the economy. Why Investors Care |
||||||||||||||||||
|
||||||||||||||||||
| ||||||||||||||||||
![[Chart]](https://lh3.googleusercontent.com/blogger_img_proxy/AEn0k_tjrlvRw5YBYAUX9QQ4iA8505vGUMJmQGf1L6PAmyqxQCvrb9Yko-22bgA_HTvCdbVkFGM6ikClk9yYi50U0-nXdNp9XB3jfPl-h-gNjExBUUOfq-Jb1g=s0-d)
![[Chart]](https://lh3.googleusercontent.com/blogger_img_proxy/AEn0k_sd6Lv2aIK3SIfxWcT6-N22k9OkMm3z1KkzJ9Q5m1aouy6iPEPZE57zJ8tR5N4Rh9jQAO38z9EdYSztsZkgVM7TMo25-2w-PDiMBFVFQqQQunl_-GAcOA=s0-d)
Saturday, October 27, 2012
Friday, October 26, 2012

3rd quarter GDP numbers
Increase: 2% annual rate, above expectation of 1.5%
Comments:
The increase in real GDP in the third quarter primarily reflected positive contributions from personal consumption expenditures (PCE), federal government spending, and residential fixed investment that were partly offset by negative contributions from exports, nonresidential fixed investment, and private inventory investment. Imports, which are a subtraction in the calculation of GDP, decreased.
The acceleration in real GDP in the third quarter primarily reflected an upturn in federal government spending, a downturn in imports, an acceleration in PCE, a smaller decrease in private inventory investment, an acceleration in residential fixed investment, and a smaller decrease in state and local government spending that were partly offset by downturns in exports and in nonresidential fixed investment.
Read more at http://www.calculatedriskblog.com/2012/10/real-gdp-increased-20-annual-rate-in-q3.html#6hOy5wiSRpoW9MmD.99
http://www.calculatedriskblog.com/2012/10/real-gdp-increased-20-annual-rate-in-q3.html

====================
Comprehensive discussion: http://www.ritholtz.com/blog/2012/10/gdp-better-thx-to-defense-spending/


=---------------------------
http://global.econoday.com/byshoweventfull.asp?fid=451307&cust=global-premium&year=2012&lid=0#top
Comments:
- Government spending increases most in two years
- Business spending falling; await fiscal cliff resolution
- Housing purchases increase
The increase in real GDP in the third quarter primarily reflected positive contributions from personal consumption expenditures (PCE), federal government spending, and residential fixed investment that were partly offset by negative contributions from exports, nonresidential fixed investment, and private inventory investment. Imports, which are a subtraction in the calculation of GDP, decreased.
The acceleration in real GDP in the third quarter primarily reflected an upturn in federal government spending, a downturn in imports, an acceleration in PCE, a smaller decrease in private inventory investment, an acceleration in residential fixed investment, and a smaller decrease in state and local government spending that were partly offset by downturns in exports and in nonresidential fixed investment.
Read more at http://www.calculatedriskblog.com/2012/10/real-gdp-increased-20-annual-rate-in-q3.html#6hOy5wiSRpoW9MmD.99
http://www.calculatedriskblog.com/2012/10/real-gdp-increased-20-annual-rate-in-q3.html

====================
Comprehensive discussion: http://www.ritholtz.com/blog/2012/10/gdp-better-thx-to-defense-spending/
GDP better thx to defense spending
By Peter Boockvar - October 26th, 2012, 8:13AM
GDP in Q3 rose 2.0%, better than expectations of 1.8% and an improvement from the 1.3% rise in Q2. Nominal GDP was up by 4.8%, well above the estimate of 3.9% as the Price Deflator was up by 2.8%, the 2nd most gain since Q3 ’08 and higher than the forecast of 2.1%. Personal Spending was up by 2%, actually a touch less than expected. Gross Private Investment was up by .5%, below the gain seen in Q2 as spending on equipment and software was flat after solid gains in previous quarters. Residential construction picked up some of that slack with a 14.4% rise. Trade was a modest drag as exports fell 1.6% while imports were lower by just .2%. Federal Government spending looks like the main driver of the better than expected headline print as it rose by 3.7% led by a 13% gain in defense spending. Spending at the state and local level fell by a .1%. Inventories were a tiny drag as they rose less than the gain seen in Q2. Real final sales, taking out the inventory influence, rose by 2.1% vs 1.7% in Q2 and 2.4% in Q1. Bottom line, 2% growth is about in line with the average seen over the past three years of 2.1% but the deceleration in trend is evident as the economy grew 2.4% in ’10, 1.8% in ’11 and averaging 1.8% in ’12. Mathematically, GDP should grow at population growth + productivity. Population is growing by 1% and productivity just 1% vs the 30 yr average productivity growth of 2.2%. We need more savings and investment for this, not more borrowing and spending pushed by gov’t monetary and fiscal policy.
=---------------------------
http://global.econoday.com/byshoweventfull.asp?fid=451307&cust=global-premium&year=2012&lid=0#top
| |||||||||||||||||||||||||||||||||||||||||||||||||||||||||||||||||||||||||||||||||||||||||||||||||||
powered by  | |||||||||||||||||||||||||||||||||||||||||||||||||||||||||||||||||||||||||||||||||||||||||||||||||||
| Resource Center » U.S. & Intl Recaps | Event Release Dates | Event Definitions | Today's Calendar | |||||||||||||||||||||||||||||||||||||||||||||||||||||||||||||||||||||||||||||||||||||||||||||||||||
| |||||||||||||||||||||||||||||||||||||||||||||||||||||||||||||||||||||||||||||||||||||||||||||||||||
![[Chart]](https://lh3.googleusercontent.com/blogger_img_proxy/AEn0k_tgs9JkFjZ_VF06uF60VCWHms8_TpdhhAlek5VilDcYtUqizNDaOnI5o9HZbGFCMPcuMzqHMrjAT2N_I0Xc7wQzl_nRCfa9JTYXAgweJwItgQjvWFCxJ03dHQ=s0-d)
![[Chart]](https://lh3.googleusercontent.com/blogger_img_proxy/AEn0k_uOrVHYEccrwRGKlaspoJDZMbUF6inOe3I9hFAEjG1ZJJfmZGMVE1pDCIYweE48kLNxFjVY2zKcN-jEWDWOzwkY7VCp84UloWGnUdyBkX_c7tPxZ74vMxrl=s0-d)


Subscribe to:
Posts (Atom)