|
|||||||||||||||||||||||||||||||||||||||||||||||||||||||||||||||||||||||||||||||||||||||||||||||||||||||||||||
POWERED BY

|
|||||||||||||||||||||||||||||||||||||||||||||||||||||||||||||||||||||||||||||||||||||||||||||||||||||||||||||
|
U.S. & Intl Recaps | Event Definitions | Today's Calendar
|
|||||||||||||||||||||||||||||||||||||||||||||||||||||||||||||||||||||||||||||||||||||||||||||||||||||||||||||
|
| ||||||||||||||||||||||||||||||||||||||||||||||||||||||||||||||||||||||||||||||||||||||||||||||||||||||||||||
Tuesday, September 30, 2014
GDP
http://mam.econoday.com/byshoweventfull.asp?fid=461146&cust=mam&year=2014&lid=0&prev=/byweek.asp#top
![[Chart]](https://lh3.googleusercontent.com/blogger_img_proxy/AEn0k_uLK-mAPpElwRYuX8Q4U5E-YUsuhix6uLNPjsiIEw5zWl42RmCj8djWsHByu28hN0r0sr1swvSTeG1cn2VwaHKiTVj69uA50MXeRptpKnGaF-c_R4Otgw=s0-d)
![[Chart]](https://lh3.googleusercontent.com/blogger_img_proxy/AEn0k_thbGKGJ5kDox64HOzdobrPsQVVhBoN93bcP38z6iiTz-pLGlGbw7JZuelmnQ1eRCaZWjT1DghtawIyJDY63W3Gw6js53hwpdnUFkcWdS0CuoIAOn_Y=s0-d)
Thursday, September 25, 2014
Billionaire education
http://www.ritholtz.com/blog/2014/09/billionaire-education/
Funny, this came up at dinner just last night:

Source: Wealth-X and UBS Billionaire Census 2014

Category: Finance, Research, Wages & Income
Funny, this came up at dinner just last night:

Source: Wealth-X and UBS Billionaire Census 2014

Category: Finance, Research, Wages & Income
Please use the comments to demonstrate
your own ignorance, unfamiliarity with empirical data and lack of
respect for scientific knowledge. Be sure to create straw men and argue
against things I have neither said nor implied. If you could repeat
previously discredited memes or steer the conversation into irrelevant,
off topic discussions, it would be appreciated. Lastly, kindly forgo all
civility in your discourse . . . you are, after all, anonymous.
Tuesday, September 23, 2014


Thursday, September 18, 2014
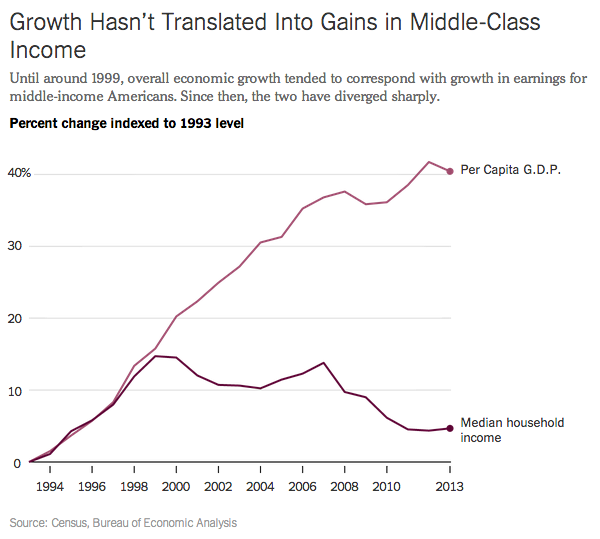
GDP growth and incomes
http://www.ritholtz.com/blog/2014/09/10-wednesday-pm-reads-33/
You Can’t Feed a Family With GDP

Source: The Upshot
You Can’t Feed a Family With GDP
Source: The Upshot
Tuesday, September 16, 2014

Thursday, September 11, 2014
Economic impact of September 11, 2001 terrorist attack
Tuesday, September 9, 2014
Unemployment in August 2014
http://bloomberg.econoday.com/byshoweventfull.asp?fid=461122&cust=bloomberg-us&year=2014&lid=0&prev=/byweek.asp#top
|
||||||||||||||||||||||||||||||||||||||||||||||||||||||||||||||||||||||||||||||||||||||||||||||||||||||||||||||||||
POWERED BY

|
||||||||||||||||||||||||||||||||||||||||||||||||||||||||||||||||||||||||||||||||||||||||||||||||||||||||||||||||||
|
Resource Center » Event Release Dates | Event Definitions | Today's Calendar
|
||||||||||||||||||||||||||||||||||||||||||||||||||||||||||||||||||||||||||||||||||||||||||||||||||||||||||||||||||
|
||||||||||||||||||||||||||||||||||||||||||||||||||||||||||||||||||||||||||||||||||||||||||||||||||||||||||||||||||
![[Chart]](https://lh3.googleusercontent.com/blogger_img_proxy/AEn0k_viqhxN5ks_-i3EFfzZQ3GVoNuIvzAmyw26FjGYuHzJyXQq2faUNh_fO049ISdk8owNHJYo0B9CgcjMO5SD9ZjHyRwehe7DHEsZYy3Y6rvcXU8kHVf9miz62xsH=s0-d)
![[Chart]](https://lh3.googleusercontent.com/blogger_img_proxy/AEn0k_spjjxMjiCkw82PRbAygTZPSci-MZenFcZsn-Q3WmnWEGpiwHkLhmphUxCxOmmgxoMaQVyF2Apu26qfhinTVOUMa0ZESqoc49deU4q2ZzagN62k8_Snr9xmSrcqoA=s0-d)
Thursday, September 4, 2014
Unemployment for July 2014
http://www.bloomberg.com/markets/economic-calendar/
http://bloomberg.econoday.com/byshoweventfull.asp?fid=461121&cust=bloomberg-us&year=2014&lid=0&prev=/byweek.asp#top
http://bloomberg.econoday.com/byshoweventfull.asp?fid=461121&cust=bloomberg-us&year=2014&lid=0&prev=/byweek.asp#top
| Employment Situation | |||||||||||||||||||||||||||||||||||||||
|
|||||||||||||||||||||||||||||||||||||||
|
Highlights
Payroll growth was on the soft side in July but still moderately positive. Markets see the latest numbers as not moving up the Fed's schedule for interest rate increases. Total nonfarm payroll jobs rose 209,000 in July after a 298,000 gain in June and a 229,000 rise in May. The net revision for the prior two months was up 15,000. Expectations for July were for 233,000. The unemployment rate nudged up to 6.2 percent from 6.1 percent in June. Expectations were for 6.1 percent. Turning back to the payroll report, private jobs advanced 198,000 after a 270,000 increase the month before. Analysts forecast 233,000. It was the goods-producing sector that was relatively healthy, gaining 58,000 in July, following a 38,000 rise in June. Manufacturing posted a 28,000 increase, following a 23,000 gain the month before. Construction jobs advanced 22,000 after a 10,000 rise in June. Mining increased 8,000 in July after a 4,000 rise in June. Private service providing jobs decelerated to a gain of 140,000 after a boost of 232,000 in June. Slowing was seen in retail trade, education & health services, and professional & business services. Government jobs rose 11,000 after a 28,000 boost in June. Average weekly hours were unchanged at 34.5 hours, matching expectations. Growth in average hourly earnings was flat at 0.0 percent after a 0.2 percent rise in June. The median market forecast was for 0.2 percent. Overall, today's report is on the soft side and will not tip the Fed's hand to accelerate rate increases. On the news, equity futures rose somewhat. |
|||||||||||||||||||||||||||||||||||||||
|
Market Consensus before announcement
Nonfarm payroll employment increased 288,000 in June after a 224,000 gain in May and a 304,000 rise in April. The net revision for the prior two months was up 29,000. April's gain was the first plus 300,000 figure since January 2012. The unemployment rate surprisingly fell to 6.1 percent from 6.3 percent in May. Expectations were for 6.3 percent. The U6 underemployment rate edged down to 12.1 percent from 12.2 percent in May. Turning back to the payroll report, private jobs gained 262,000 after a 224,000 boost the month before. Government jobs jumped 26,000 after being flat in May. Average weekly hours were unchanged at 34.5 hours. Growth in average hourly earnings held steady at 0.2 percent, also matching the consensus. |
|||||||||||||||||||||||||||||||||||||||
|
Definition The employment situation is a set of labor market indicators based on two separate surveys in this one report. The unemployment rate equals the number of unemployed persons divided by the total number of persons in the labor force, which comes from a survey of 60,000 households (this is called the household survey). Workers are only counted once, no matter how many jobs they have, or whether they are only working part-time. In order to be counted as unemployed, one must be actively looking for work. Other commonly known figures from the Household Survey include the labor supply and discouraged workers. Why Investors Care |
|||||||||||||||||||||||||||||||||||||||
|
|||||||||||||||||||||||||||||||||||||||
| |||||||||||||||||||||||||||||||||||||||
![[Chart]](https://lh3.googleusercontent.com/blogger_img_proxy/AEn0k_v07Eqfl13A-Y57bU8V1lD0am5MunZASeNh3tb-m999XuBzy0_IdDp8fvpquC8CByL4if6JvaL0UnxlxS74c6LWu9IhIoQPlPSw2kfRXeLORYtrO19a2oF4BFQA=s0-d)
![[Chart]](https://lh3.googleusercontent.com/blogger_img_proxy/AEn0k_vcpflm4B1gFvgaPV22uSNfqzItnye2rFb73knITj3RV1fpnDuo9kRX5zh89YfWVNDDqJeW-Zud_unPWkq1abaP0sMuDpENtLeyMF4-B1t46xykCTx-cjkyip4b=s0-d)
Subscribe to:
Comments (Atom)